I spent years preaching market share as the foundation of every agent’s strategy. Then I hesitated mid-sentence and couldn’t stop thinking about why.

I was sitting in a boardroom with a new sales agent, let’s call him Alex, explaining how goal setting based on market share would provide clarity and long-term success, when I paused.
It wasn’t a dramatic pause; it probably looked like I was searching for the right word. But something had stopped me mid-sentence. A small, uncomfortable recognition that what I was about to say no longer felt entirely true. I’d given this explanation dozens of times. The logic for building a sales-agent strategy was clean: “Market share is your target.” Everything else (appraisals, presentations, listings, and sales) cascades from that first number. The market value is the sum of all dwellings in a defined area that have sold (churn) within a 12-month period. Get the total market value right, and the whole funnel follows.
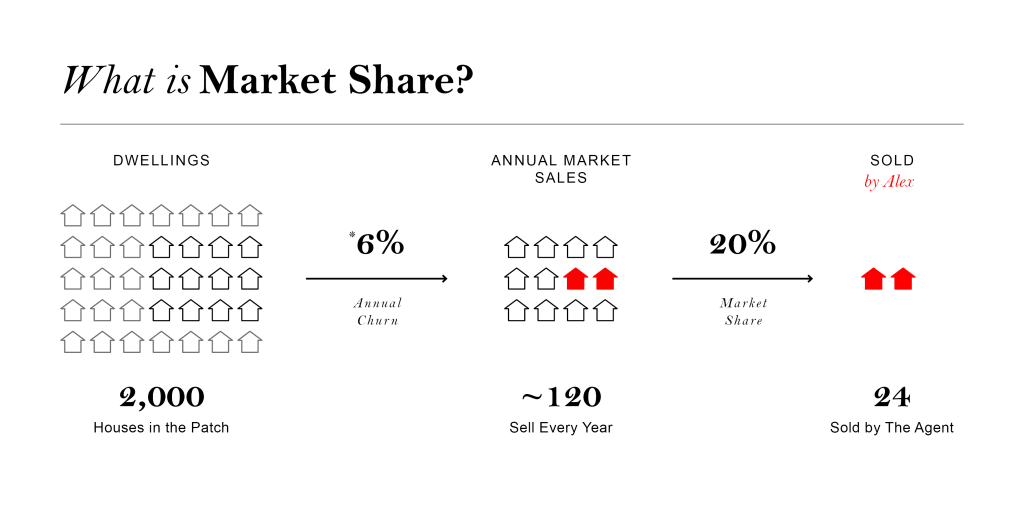
Except I’d spent the last six months reading about uncertainty. I’d read Spitznagel on cost-effective risk mitigation, ensemble weather forecasting, and the basics of chaos theory. The compounding insight from all of it: small errors in initial conditions produce wildly different outcomes, and predicting the future with precision isn’t difficult, it’s impossible. That idea had been quietly rearranging my thinking for months, but my speech hadn’t changed at all.
I realised that trying to forecast the exact market value was like trying to predict the weather: I could have a rough idea, but providing a single number with confidence is simply wrong.
The Number Nobody Admits They’re Guessing
Market share is a percentage, but a percentage of what exactly? It should be next year’s total market value, the problem: that number doesn’t exist yet. So when I told agents to target 20% market share, I was asking them to aim for 20% of an unknown number.
In the world of residential sales, high market share is the ultimate prize. By concentrating your efforts on a specific local region, you can establish yourself as an “attraction agent.” At this stage, your reputation precedes you, sellers begin to seek you out, your network of buyers becomes near-complete, and your career could enter a powerful self-sustaining cycle of growth.
There are two ways the industry typically arrives at a total market value figure. The first (A) is simple: take last year’s total sold value and assume it’s a reasonable proxy for next year. The second (B) is slightly more considered: take the average historical churn rate for the suburb, say 6%, multiply it by the total number of properties and the median price, and that gives you your expected market size.
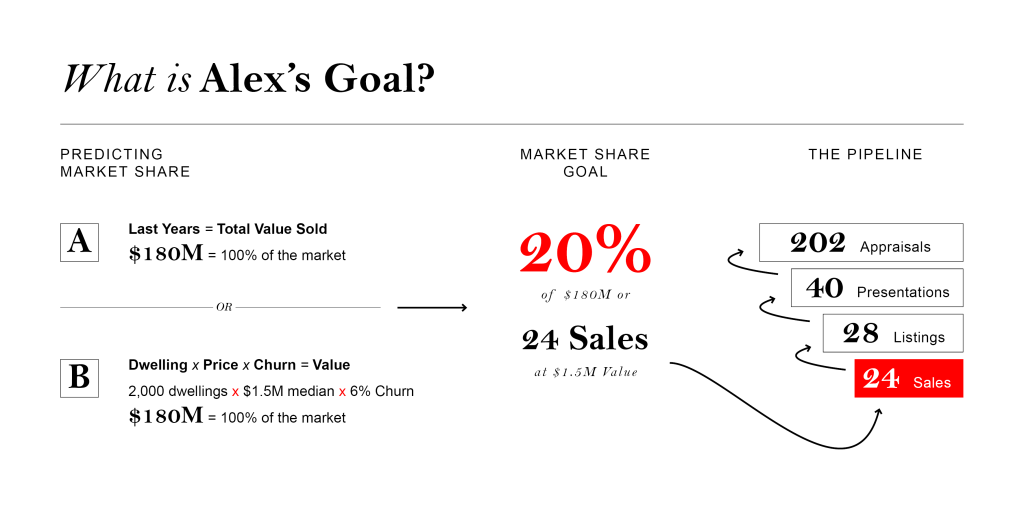
Both methods are internally coherent, and both produce a single, clean number. However, both also contain the same buried assumption: that the market will behave next year the way it has, on average, in the past. This is the industry standard; a simple, clean figure that provides the motivational clarity agents need for proactive outbound action. When these focused KPIs are executed with consistent client-relationship building, it often works.
The problem is confidence. A single-point estimate implies a level of certainty about an unpredictable system that simply isn’t warranted. This is what Nassim Taleb calls Mediocristan thinking applied to an Extremistan system. In Mediocristan (human heights, daily coffee sales, stable manufacturing output) averages are meaningful and single-point forecasts are reasonable. In Extremistan (financial markets, real estate, daily weather, anything driven by human sentiment and external shocks) rare events dominate, averages mislead, and a point estimate is not a plan. It’s a bet dressed as a plan.
The agent who had a record year, set the following year’s targets accordingly, then watched the market correct beneath them didn’t make a strategic error. They made a forecasting error that was invisible, because they never acknowledged they were forecasting at all.
And here’s what this means in practice. The funnel methodology isn’t the problem. Conversion ratios, appraisal targets, listing presentations: all of that is percentage-based and self-correcting, if you get the inputs right the cascade follows. But every number in that funnel sits on top of one figure that nobody has verified (total market value estimate). Fix that number and everything downstream fixes itself. Leave it broken and everything downstream is confidently wrong.
I believe the reason nobody talks about this isn’t negligence, it’s that nobody had a better answer.
Why Not Just Build a Better Model?
The natural response to years of big data is to find correlations. Feed in interest rates, population growth, auction clearance rates, let a model learn the patterns and extrapolate forward. This is what sophisticated analysts do. And it has a specific failure mode: it learns the past too well, including the noise, and mistakes that noise for signal. When conditions change, when the reason things correlated stops being true, the model fails confidently. It doesn’t widen its uncertainty, it just produces a wrong number with the same precision as before.
There’s a deeper problem beneath that. Correlation models assume behaviour follows discoverable logic. Real-estate buyers (and therefore prices) don’t follow discoverable logic: a mother pays a premium because her church is in the suburb; a buyer overpays because he made money here once and it feels lucky; another walks away from a genuine bargain because school-catchment lines were redrawn in 1987. These decisions are real, they move prices, and they are completely invisible to any model built on the assumption that cause and effect can be untangled. The residential real-estate market is a non-linear dynamical system. Small, irreducible human decisions compound in ways that no correlation model can capture.
The idea is to forget about understanding the mechanisms behind why everything happens, and observe the emergence of a distinct, local shape you can prepare for.
Imagine you’re planning an outdoor wedding across three locations, each with a different chance of rain. If the first is an outback Queensland venue with a 5% chance, a robust plan might be simple: a small stack of emergency umbrellas. The low probability doesn’t warrant a high cost. If the location had a 40% chance, like a common seaside town, a large rented tent becomes a cost-effective necessity, as the downside risk is too great to ignore for the couple’s big day. However, if the wedding is in Tasmania, you might just move the entire reception indoors. The decision isn’t about getting a better weather forecast for that day, but choosing the right level of preparation based on the shape of the local distribution.
So after feeling unsure for a while, I decided if I can’t precisely predict the future, I shouldn’t. But I didn’t need to choose between a single point lie and total nihilism. Just like weather forecasts, maybe I could narrow the range.
A Possible Path Through the Storm
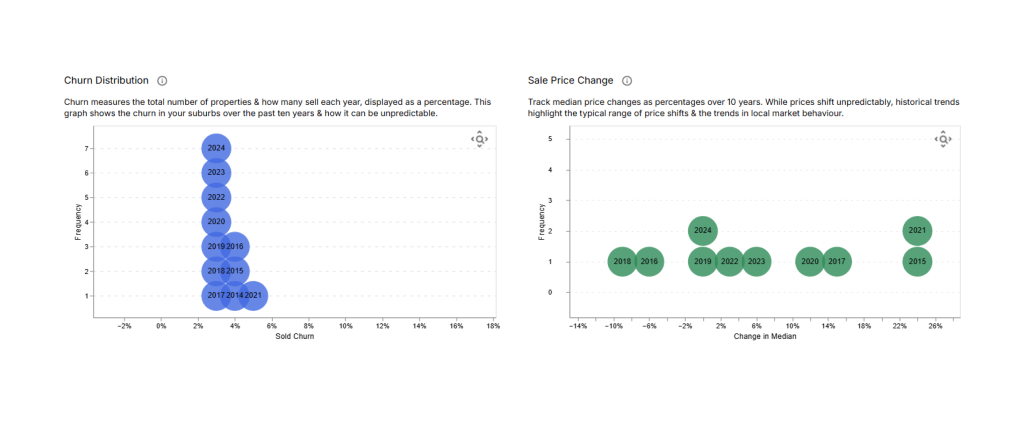
But how could weather forecasting be translated to real-estate markets? Then it clicked. It’s not the median price; it’s the annual price-change, together with churn (the proportion of properties that actually sell in any given year). Those are two variables that could determine likely market values, and both have a distribution that matters if you look at it locally. A unique fingerprint or a range of things that have actually happened over the past decade, suburb by suburb and property-type by property-type.
This is the logic behind my choice of the Monte Carlo method for local real-estate markets. I don’t need to know why North Rocks houses churn at 3–6% per year. I don’t need to model the buyers’ motivations, the council decisions, or the interest-rate sensitivity of that particular demographic. I only need to observe that churn has a shape, and that shape has been stable enough over recent years to sample honestly.
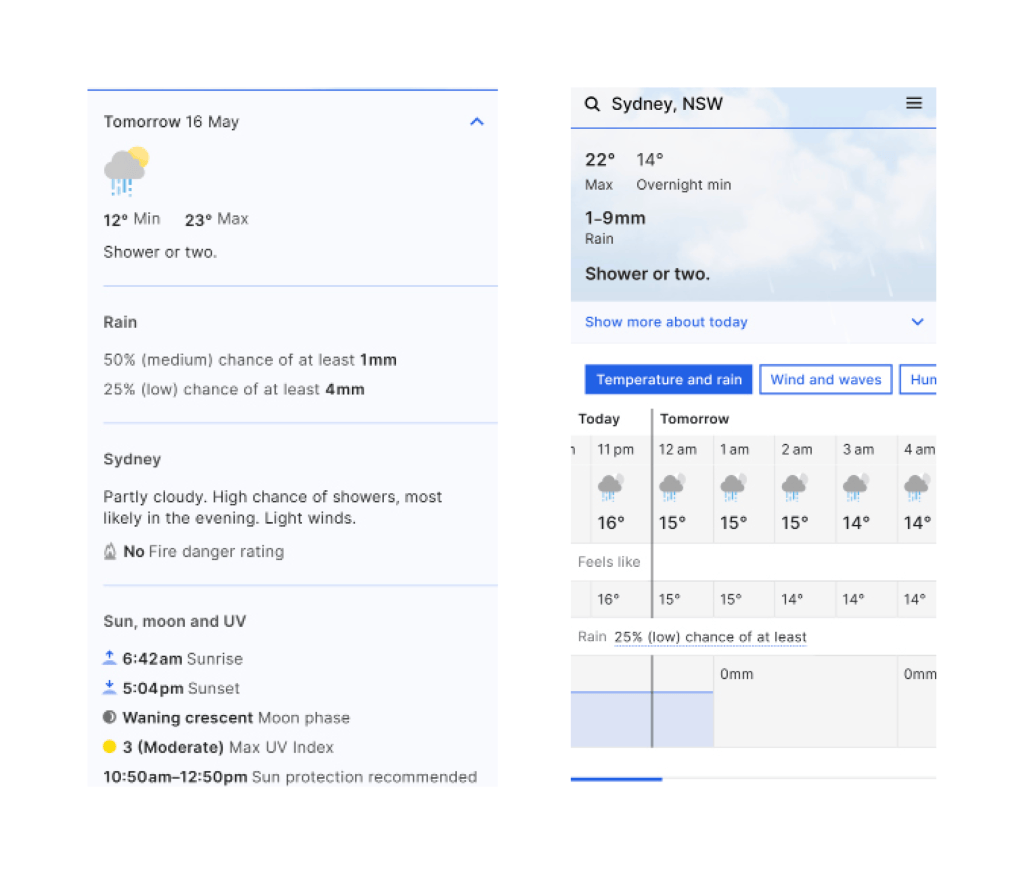
From those two distributions, a Monte Carlo simulation runs thousands of combinations forward. Not one future, many futures in parallel. A fan of possible outcomes, wide at the far end, narrow at the start. I can be certain about what happened today, then as time passes the spread widens. A tight fan means high confidence, a wide fan means genuine uncertainty. This is exactly what meteorologists figured out in the 1990s when they stopped issuing single-path forecasts and started running ensemble models instead. “70% chance of 15mm of rain” isn’t vague, it’s more honest than “it will rain tomorrow.”
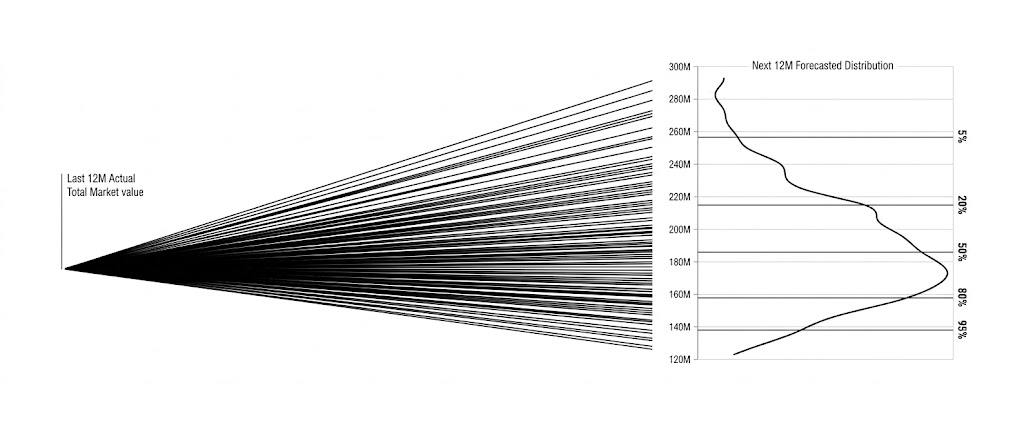
From that fan, I can back-calculate. Set a confidence level, say, 50%, and ask: what does the commission pool look like at that probability threshold? What KPIs does an agent need to hit to reach their income goal within a market that size? The funnel still exists. The cascade still works. But now it’s anchored to a credible range rather than a single borrowed number.
By thinking in confidence levels, you could enable pre-year scenario planning based on multiple market conditions and gain the flexibility to deploy “adaptive tactics” mid-year, acknowledging that market reality won’t take your business plan into consideration.
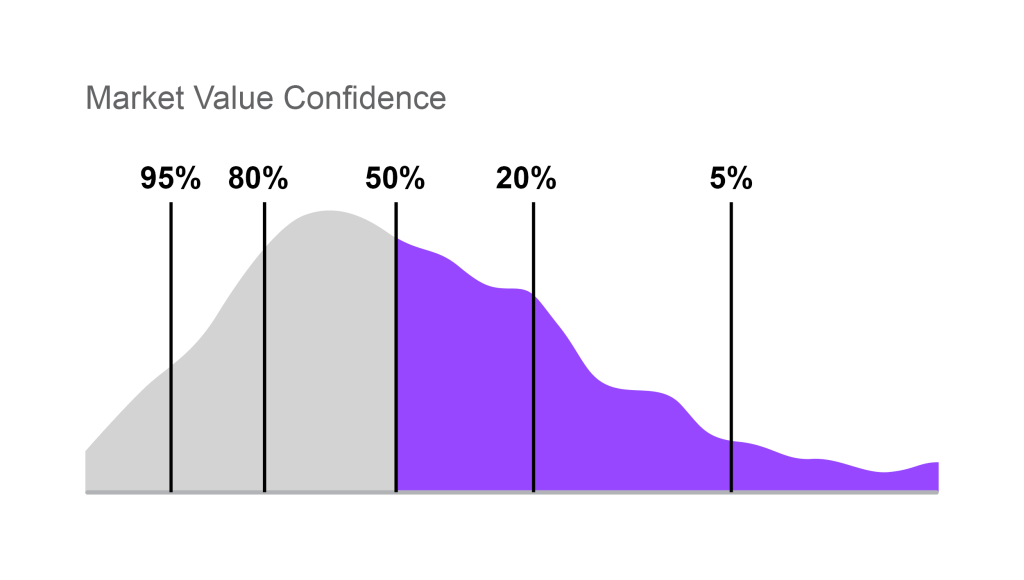
Team structure is one example. An agent who planned from a single point estimate and hired for their “most likely” market has fixed costs locked in before the year starts. When the market comes in at the 30th percentile, their overhead stays the same and their margin collapses. An agent who planned from a distribution built a different structure: a smaller fixed base, with higher campaign-based incentives, plus a deal with a new agent in the office to join campaigns if they get busy. The range didn’t eliminate uncertainty. It narrowed the decisions that mattered, so the business could adapt to the outcome that actually arrived.
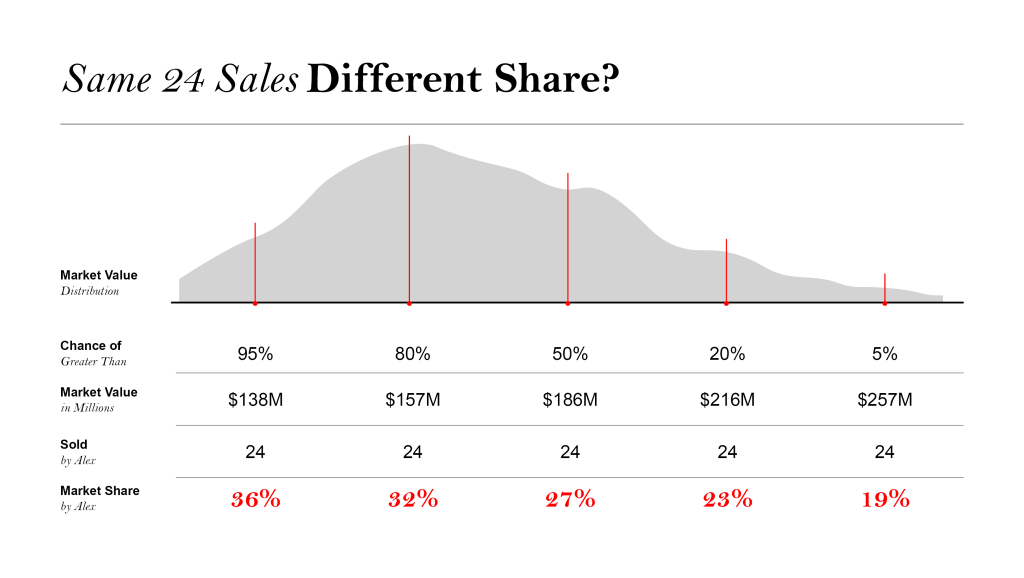
The language I’m currently using is not perfect but it is more honest. I now say, “Your market value has a 50% chance of being greater than $185 million.” Why would I use vague language? Because the Bureau of Meteorology spends over $400 million (AUD) a year and still uses words like “chance” and “most likely” to describe tomorrow’s forecast.
The Tension I Can’t Resolve
Here’s where it gets hard. And I want to be honest that it stays hard.
Mark Spitznagel’s argument in Safe Haven isn’t about accuracy. It’s about compounding. The investment strategies that look suboptimal in any given year, the ones that protect the downside and don’t overcommit to the most likely scenario are the ones that produce the best returns over decades.
I have a 20-year market-share strategy. By that logic, planning from a distribution beats optimising for a point estimate. An agent aiming to grow market share above 30% to become an attraction agent needs to remember the market “chance”. Sustaining high market share and letting customer perception compound over time should be an all-weather strategy. Over 20 years, consistency is worth more than optimisation.
That argument is sound. And it doesn’t solve my problem at all, because I manage an organisation. I have a feeling Alex the agent doesn’t want to hear about stochastic probability modeling from me.
Edwin Locke and Gary Latham spent 35 years studying goal-setting across 40,000 people in organisations around the world. Their finding is consistent and robust: specific, challenging goals drive higher performance than vague ones. The number and precision matter. The target on the wall: 20% market share, 24 sales, 202 appraisals. This is what gets an agent out of bed at 5am and onto the phone. Uncertainty doesn’t motivate people, certainty does.
Spitznagel’s book is solid because he manages a fund and has evidence his theory works; his investors opted in and he controls the strategy. I sit across from people who need to believe in a number to perform. I can’t just hand them a probability distribution and say, “Good luck, mate.” Alex is a salesperson; he craves certainty, clarity, and positive reinforcement inside the office because when he steps outside, it is the total opposite, and he needs the courage to keep doing it every day.
So the tension is more than intellectual, it’s operational. I can’t just control my own behaviour, I need to work with others to achieve results. And that distinction makes everything harder.
Maybe the industry’s single-point forecast is a pragmatic trade: complex truth exchanged for motivating language. Maybe that trade is defensible because the useful fiction is getting good outcomes, and sharing the complexity would damage performance.
Or maybe useful fictions hide fragility. Is the agent who can’t separate what they earned from what the market handed them using pseudoscience to make decisions? Maybe the tunnel vision that Locke and Latham themselves identified, optimising for the number rather than the capability, is exactly what’s happening across the industry every year.
I don’t have a clean answer. I built the tool and changed my language. I’ve gained clarity on the forecasting problem, but I’m still thinking about the management problem.
I now ask myself
- What number in my business have I stopped questioning, not because I verified it, but because everyone around me uses it?
- Am I trading complex truths for simple language? And do I know when that trade stops being useful?
- When I had a good year, how much of it did I earn and how much did the market hand me? And do I actually know the difference?
Extra Reading: How the Model Works
The simulation runs on two input distributions drawn from ten years of local market data, segmented by suburb and property type.
Churn measures what proportion of the total property population sells in a given year. In a suburb of 300 freestanding houses, a 3% churn year means 9 properties sold. A 5% churn year means 15. The historical distribution of churn tells you the realistic range, not a guarantee, but the actual observed behaviour of that market.
Year-on-year price-change captures median price movement. Crucially, this is change, not level, which stabilises the input considerably compared to using raw median prices, which drift significantly over a decade.
Combining these two distributions across thousands of simulated draws produces a total market value distribution. Each simulation picks one churn value and one price change value, calculates total sold value, and records it. After enough iterations, the shape of the distribution becomes clear.
Freestanding houses in established suburbs tend toward approximate normality: a relatively symmetric distribution with modest tails. Apartments behave differently: supply can surge with new developments, producing more irregular distributions with longer right tails. This is why the model segments by property type. The shapes are genuinely different, and treating them as one population would obscure the signal.
The segmentation by suburb is equally deliberate. Sydney-wide or Australia-wide statistics introduce so much variance they become meaningless for planning at the agent level. The median price in Sydney is irrelevant to an agent working North Rocks houses. Staying local keeps the distribution honest, and, as it turns out, more stable.
The confidence intervals on the goal-seeking page represent simple percentile thresholds from the simulated distribution. Choosing 50% confidence means your plan is viable if the market lands at or above the median simulated outcome. Choosing 80% means you’re planning for a tougher market, and your KPIs adjust accordingly. The funnel doesn’t change. The starting assumption does.
The model doesn’t predict. It describes the range of what’s probable, and lets you decide how much uncertainty you’re willing to absorb before you commit to a plan.

Leave a Reply